The Index of Political Economy Achievements (IPEA) Global Ranking: on & to the New Conception of Societal Governance
26.01.2017 Yuriy O. CHERNETSKIY (Kharkiv and Zhytomyr), Doctor of Sociological Sciences, Ph.D. in Economics & Management, Master of Arts in Political Economy, author of 12 books and more than 400 articles –
specially for the NEWSSKY.COM.UA Journal
This article is about a new statistical indicator I propose to count and to use in social science analyses, namely: “the Index of Political Economy Achievements” (IPEA).
For the IPEA calculation let me remind that in one of my previous articles devoted to the international political economy matters I have proposed the set of three global rankings for 160 countries of the world with the 2014 and 2015 population of 0.7 million or more. The so called Democracy Index calculated by specialists of the Economist Intelligence Unit (EIU) was seen as the basic indicator there. In 2015 this index has been counted up also for six democratic “micro-states” with population from 0.3 to 0.6 million, namely: Iceland, Luxembourg, Malta, Cabo Verde, Suriname and Montenegro. Reference information on these countries is included into my table but without defining their rankings’ places.
Also the Democracy Index has not been calculated for South Sudan (11.3 million 2014 population) and Somalia (10.5 million 2014 population). These countries are “leaders” in sad sense for many years of so called Fragile States Index (former Failed States Index) ranking. In fact, they have no minimally effective government of the united state’s scale. By the way, under this ranking in 2015 the Russian Federation was in the “High Warning” states group at the 65th place and UKRAINE was in the more safe “Warning” states group at the 84th place.
Finally, in the EIU rating the Chinese statehood is represented not only by China and Taiwan (in fact, the last has been functioning as an independent state for decades) but also by Hong Kong. As in the case of “micro-state”, I include in my table just reference information on Hong Kong without defining its rankings’ places. Therefore, all 160 really existing and functioning states (countries) of the world with 0.7 million or more population have been and remain represented in my generalizing table.
The methodology of Democracy Index calculation is characterized in the publication “Democracy in an age of anxiety” which can be found on the EIU site (www.eiu.com) in PDF format. This index, on a 0 to 10 scale, is based on the ratings for 60 indicators, grouped into five categories: electoral process and pluralism; civil liberties; the functioning of government; political participation; and political culture. Each category has a rating on a 0 to 10 scale, and the overall Index is their simple average.
RANKING BY THE INDEX OF POLITICAL ECONOMY ACHIEVEMENTS
(for 160 countries of the world with the 2015 population of 0.7 million and more; after the democracy and economic performance indexes values places of a country in the democracy index and GNI (PPP) per capita 2015 rankings are shown in brackets)
|
COUNTRIES |
2015 Democracy Index |
2015 Economic Performance Index |
2015 Political Economy Achievements Index |
| 1. Norway | 9.93 (001) | 6.45 (005) | 8.19 |
| –. Luxembourg | 8.88 (–––) | 7.08 (–––) | 7.98 |
| 2. Switzerland | 9.09 (005) | 6.26 (006) | 7.68 |
| 3. Singapore | 6.14 (068) | 8.14 (003) | 7.14 |
| –. Iceland | 9.58 (–––) | 4.65 (–––) | 7.12 |
| 4. Sweden | 9.45 (002) | 4.75 (014) | 7.10 |
| 5. Ireland | 8.85 (010) | 5.19 (009) | 7.02 |
| 6. Denmark | 9.11 (004) | 4.78 (013) | 6.95 |
| 7. United States | 8.05 (017) | 5.75 (007) | 6.90 |
| 8. Netherlands | 8.92 (009) | 4.81 (011) | 6.87 |
| 9. Australia | 9.01 (008) | 4.46 (016) | 6.74 |
| 9. Canada | 9.08 (006) | 4.40 (017) | 6.74 |
| 9. Germany | 8.64 (011) | 4.84 (010) | 6.74 |
| 12. Austria | 8.54 (012) | 4.79 (012) | 6.67 |
| 13. Qatar | 3.18 (127) | 10.00 (001) | 6.59 |
| 14. Finland | 9.03 (007) | 4.13 (019) | 6.58 |
| 15. New Zealand | 9.26 (003) | 3.56 (026) | 6.41 |
| 16. Taiwan, the Province of China* | 7.83 (028) | 4.68 (015) | 6.26 |
| 17. United Kingdom | 8.31 (013) | 4.06 (020) | 6.19 |
| 18. Belgium | 7.93 (023) | 4.40 (018) | 6.17 |
| –. Hong Kong (China) | 6.50 (–––) | 5.79 (–––) | 6.15 |
| 19. Kuwait | 3.85 (114) | 8.44 (002) | 6.15 |
| 20. France | 7.92 (024) | 4.03 (021) | 5.98 |
| 21. Japan | 7.96 (020) | 3.89 (022) | 5.93 |
| 22. Spain | 8.30 (014) | 3.45 (029) | 5.88 |
| –. Malta | 8.39 (–––) | 3.25 (–––) | 5.82 |
| 23. Italy | 7.98 (018) | 3.59 (025) | 5.79 |
| 24. Republic of Korea | 7.97 (019) | 3.47 (028) | 5.72 |
| 25. Israel | 7.77 (030) | 3.53 (027) | 5.65 |
| 26. Czech Republic | 7.94 (022) | 3.06 (032) | 5.50 |
| 27. Portugal | 7.79 (029) | 2.86 (035) | 5.33 |
| 28. Cyprus | 7.53 (035) | 3.10 (031) | 5.32 |
| 29. Slovenia | 7.57 (032) | 3.04 (033) | 5.31 |
| 30. Estonia | 7.85 (026) | 2.72 (036) | 5.29 |
| 31. Trinidad and Tobago | 7.10 (043) | 3.22 (030) | 5.16 |
| 32. Mauritius | 8.28 (015) | 1.99 (052) | 5.14 |
| 33. Uruguay | 8.17 (016) | 2.04 (050) | 5.11 |
| 34. Lithuania | 7.54 (034) | 2.65 (039) | 5.10 |
| 35. Slovakia | 7.29 (039) | 2.86 (034) | 5.08 |
| 36. Greece | 7.45 (036) | 2.68 (038) | 5.07 |
| 37. Chile | 7.84 (027) | 2.17 (046) | 5.01 |
| 38. Latvia | 7.37 (038) | 2.42 (043) | 4.90 |
| 39. United Arab Emirates | 2.75 (141) | 7.00 (004) | 4.88 |
| 40. Poland | 7.09 (044) | 2.54 (041) | 4.82 |
| 41. Costa Rica | 7.96 (020) | 1.49 (067) | 4.73 |
| 42. Botswana | 7.87 (025) | 1.55 (064) | 4.71 |
| 43. Hungary | 6.84 (050) | 2.46 (042) | 4.65 |
| 44. Panama | 7.19 (041) | 2.05 (049) | 4.62 |
| 45. Croatia | 6.93 (048) | 2.18 (047) | 4.56 |
| 46. Malaysia | 6.43 (062) | 2.62 (040) | 4.53 |
| 47. Argentina | 7.02 (046) | 2.00 (051) | 4.51 |
| 48. Bulgaria | 7.14 (042) | 1.76 (056) | 4.45 |
| 49. South Africa | 7.56 (033) | 1.29 (076) | 4.43 |
| 50. Romania | 6.68 (054) | 2.09 (048) | 4.39 |
| 51. Brazil | 6.96 (047) | 1.51 (066) | 4.24 |
| –. Cabo Verde | 7.81 (–––) | 0.63 (–––) | 4.22 |
| –. Suriname | 6.77 (–––) | 1.66 (–––) | 4.22 |
| 52. India | 7.74 (031) | 0.60 (105) | 4.17 |
| 53. Jamaica | 7.39 (037) | 0.89 (090) | 4.14 |
| 54. Mexico | 6.55 (061) | 1.71 (058) | 4.13 |
| 55. Indonesia | 7.03 (045) | 1.07 (085) | 4.05 |
| 56. Dominican Republic | 6.67 (055) | 1.36 (071) | 4.02 |
| 57. Serbia | 6.71 (053) | 1.30 (075) | 4.01 |
| 58. Columbia | 6.62 (058) | 1.36 (074) | 3.99 |
| 59. Tunisia | 6.72 (052) | 1.13 (080) | 3.93 |
| 60. Peru | 6.58 (060) | 1.21 (077) | 3.90 |
| 61. Mongolia | 6.62 (057) | 1.12 (081) | 3.87 |
| 61. Philippines | 6.84 (050) | 0.89 (089) | 3.87 |
| 63. Timor-Leste | 7.24 (040) | 0.43 (115) | 3.84 |
| –. Montenegro | 6.01 (–––) | 1.59 (–––) | 3.80 |
| 64. Sri Lanka | 6.42 (063) | 1.15 (078) | 3.79 |
| 65. El Salvador | 6.64 (056) | 0.82 (095) | 3.73 |
| 66. Saudi Arabia | 1.93 (153) | 5.48 (008) | 3.71 |
| 67. Macedonia, the FYR | 6.02 (072) | 1.36 (073) | 3.69 |
| 68. Namibia | 6.31 (066) | 1.04 (087) | 3.68 |
| 69. Ghana | 6.86 (049) | 0.41 (117) | 3.64 |
| 70. Paraguay | 6.33 (065) | 0.87 (093) | 3.60 |
| 71. Turkey | 5.12 (090) | 1.94 (053) | 3.53 |
| 72. Albania | 5.91 (074) | 1.11 (082) | 3.51 |
| 73. Ecuador | 5.87 (076) | 1.13 (079) | 3.50 |
| 74. Lesotho | 6.59 (059) | 0.33 (125) | 3.46 |
| 74. Oman | 3.04 (135) | 3.87 (024) | 3.46 |
| 76. Republic of Moldova | 6.35 (064) | 0.54 (108) | 3.45 |
| 77. Georgia | 5.88 (075) | 0.94 (088) | 3.41 |
| 78. Guyana | 6.05 (070) | 0.75 (099) | 3.40 |
| 79. Guatemala | 5.92 (073) | 0.75 (100) | 3.34 |
| 79. Venezuela | 5.00 (092) | 1.67 (061) | 3.34 |
| 81. Bahrain | 2.79 (139) | 3.87 (023) | 3.33 |
| 82. Thailand | 5.09 (091) | 1.55 (063) | 3.32 |
| 82. Zambia | 6.28 (067) | 0.36 (119) | 3.32 |
| 84. Fiji | 5.69 (083) | 0.89 (091) | 3.29 |
| 85. Ukraine | 5.70 (081) | 0.78 (096) | 3.24 |
| 86. Bolivia | 5.75 (078) | 0.67 (101) | 3.21 |
| 87. Honduras | 5.84 (077) | 0.48 (114) | 3.16 |
| 87. Papua New Guinea | 6.03 (071) | 0.28 (130) | 3.16 |
| 87. Senegal | 6.08 (069) | 0.24 (134) | 3.16 |
| 90. Lebanon | 4.86 (095) | 1.38 (070) | 3.12 |
| 91. Bangladesh | 5.73 (079) | 0.36 (121) | 3.05 |
| 92. Benin | 5.72 (080) | 0.21 (136) | 2.97 |
| 93. Bosnia and Herzegovina | 4.83 (097) | 1.07 (086) | 2.95 |
| 93. Mali | 5.70 (081) | 0.20 (137) | 2.95 |
| 95. Tanzania | 5.58 (084) | 0.26 (132) | 2.92 |
| 96. Nicaragua | 5.26 (088) | 0.51 (111) | 2.89 |
| 97. Bhutan | 4.93 (094) | 0.76 (098) | 2.85 |
| 97. Russian Federation | 3.31 (125) | 2.38 (044) | 2.85 |
| 99. Gabon | 3.76 (117) | 1.89 (054) | 2.83 |
| 99. Kyrgyzstan | 5.33 (086) | 0.33 (123) | 2.83 |
| 99. Malawi | 5.55 (085) | 0.11 (154) | 2.83 |
| 102. Kenya | 5.33 (086) | 0.31 (127) | 2.82 |
| 103. Iraq | 4.08 (108) | 1.53 (065) | 2.81 |
| 104. Morocco | 4.66 (100) | 0.77 (097) | 2.72 |
| 105. Kazakhstan | 3.06 (133) | 2.35 (045) | 2.71 |
| 106. Uganda | 5.22 (089) | 0.18 (139) | 2.70 |
| 107. Algeria | 3.95 (111) | 1.43 (069) | 2.69 |
| 107. Cuba | 3.52 (122) | 1.86 (055) | 2.69 |
| 109. Belarus | 3.62 (120) | 1.69 (060) | 2.66 |
| 110. Nigeria | 4.62 (101) | 0.58 (106) | 2.60 |
| 111. Palestine | 4.57 (103) | 0.51 (112) | 2.54 |
| 112. Liberia | 4.95 (093) | 0.07 (159) | 2.51 |
| 112. Nepal | 4.77 (098) | 0.25 (133) | 2.51 |
| 114. Madagascar | 4.85 (096) | 0.14 (150) | 2.50 |
| 115. Jordan | 3.86 (113) | 1.08 (083) | 2.47 |
| 115. Pakistan | 4.40 (105) | 0.53 (110) | 2.47 |
| 117. Armenia | 4.00 (109) | 0.88 (092) | 2.44 |
| 117. Burkina Faso | 4.70 (099) | 0.17 (143) | 2.44 |
| 119. Mozambique | 4.60 (102) | 0.12 (153) | 2.36 |
| 119. Sierra Leone | 4.55 (104) | 0.16 (146) | 2.36 |
| 121. Myanmar | 4.14 (107) | 0.49 (113) | 2.32 |
| 122. Cambodia | 4.27 (106) | 0.33 (124) | 2.30 |
| 123. China | 3.14 (129) | 1.44 (068) | 2.29 |
| 124. Equatorial Guinea | 1.77 (156) | 2.72 (037) | 2.25 |
| 125. Azerbaijan | 2.71 (142) | 1.72 (057) | 2.22 |
| 126. Mauritania | 3.96 (110) | 0.37 (120) | 2.17 |
| 127. Egypt | 3.18 (127) | 1.07 (084) | 2.13 |
| 128. Haiti | 3.94 (112) | 0.18 (140) | 2.06 |
| 129. Viet Nam | 3.53 (121) | 0.57 (107) | 2.05 |
| 130. Angola | 3.35 (124) | 0.65 (102) | 2.00 |
| 130. Ethiopia | 3.83 (116) | 0.16 (144) | 2.00 |
| 132. Cameroon | 3.66 (119) | 0.31 (127) | 1.99 |
| 133. Niger | 3.85 (114) | 0.10 (156) | 1.98 |
| 134. Swaziland | 3.09 (131) | 0.83 (094) | 1.96 |
| 135. Comoros | 3.71 (118) | 0.15 (148) | 1.93 |
| 135. Iran | 2.16 (149) | 1.70 (059) | 1.93 |
| 137. Côte D’Ivoire | 3.31 (125) | 0.33 (126) | 1.82 |
| 138. Libya | 2.25 (146) | 1.36 (072) | 1.81 |
| 139. Togo | 3.41 (123) | 0.13 (151) | 1.77 |
| 140. Turkmenistan | 1.83 (155) | 1.58 (062) | 1.71 |
| 141. Guinea | 3.14 (129) | 0.11 (155) | 1.63 |
| 142. Rwanda | 3.07 (132) | 0.17 (141) | 1.62 |
| 143. Zimbabwe | 3.05 (134) | 0.17 (142) | 1.61 |
| 144. Djibouti | 2.90 (138) | 0.30 (129) | 1.60 |
| 145. Gambia | 2.97 (136) | 0.16 (147) | 1.57 |
| 146. Democratic Republic of the Congo | 2.91 (137) | 0.07 (158) | 1.49 |
| 147. Afghanistan | 2.77 (140) | 0.19 (138) | 1.48 |
| 148. Sudan | 2.37 (144) | 0.40 (118) | 1.39 |
| 149. Lao People’s Democratic Republic | 2.21 (148) | 0.54 (108) | 1.38 |
| 150. Congo | 2.11 (150) | 0.63 (103) | 1.37 |
| 151. Uzbekistan | 1.95 (151) | 0.62 (104) | 1.29 |
| 152. Burundi | 2.49 (143) | 0.07 (157) | 1.28 |
| 153. Yemen | 2.24 (147) | 0.27 (131) | 1.26 |
| 154. Eritrea | 2.37 (144) | 0.13 (152) | 1.25 |
| 155. Tajikistan | 1.95 (151) | 0.35 (122) | 1.15 |
| 156. Guinea Bissau | 1.93 (153) | 0.15 (149) | 1.04 |
| 157. Syrian Arab Republic | 1.43 (159) | 0.42 (116) | 0.93 |
| 158. Chad | 1.50 (158) | 0.21 (135) | 0.86 |
| 159. Central African Republic | 1.57 (157) | 0.06 (160) | 0.82 |
| 160. Democratic People’s Republic of Korea | 1.08 (160) | 0.16 (145) | 0.62 |
Sources of the information basic for the IPEA count: publications of the Economist Intelligence Unit Limited (Democracy Index) and World Bank (GNI (PPP) per capita).
As the EIU does, I also place countries within one of four types of regime according to their Democracy Index values. But, on my mind, the EIU’s differentiation of “full democracies” and “flawed democracies” is somewhat mechanical or formal. Taking into account the contents of polity, politics and policies, I single out developed democracies with the scores of 7.70–10; that adds to the highest group 14 countries, namely: Italy, South Korea, Costa Rica, Japan, the Czech Republic, Belgium, France, Botswana, Estonia, Chile, Taiwan, Portugal, Israel, India (Cabo Verde is out of my rating). The rest of “flawed democracies” constitutes the group of other democracies (the scores of 6–7.69) under my classification. Both the groups of countries with “hybrid regimes” (the scores of 4–5.99) and with “authoritarian regimes” (the scores below 4) are the same as in the EIU’s rating. Finally, the distribution of 160 states between four groups in my version is such:
1. Developed democracies – 31 (19.4%)
2. Other democracies – 41 (25.6%)
3. Hybrid regimes – 37 (23.1%)
4. Authoritarian regimes – 51 (31.9%)
Further, it is useful to differentiate two categories of states: democratic countries (it embraces developed and other democracies) and non-democratic countries (it includes hybrid and authoritarian regimes). The distribution of 160 states will be such:
- Democratic countries – 72 (45.0%)
- Non-democratic countries – 88 (55.0%)
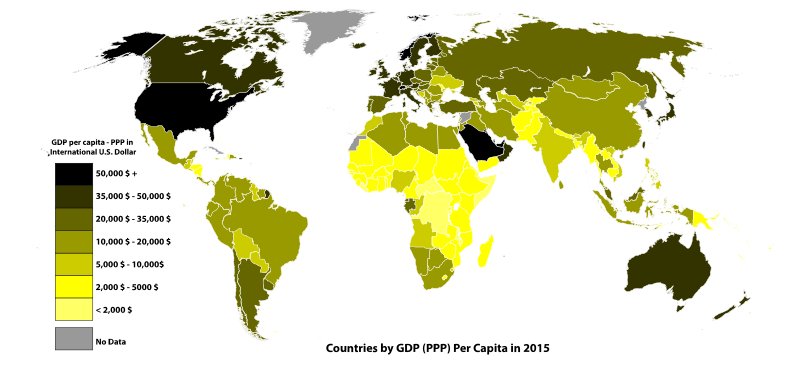
Also I have evaluated correlation of Democracy Index with the level of economic development indicators. In this case I have realized the states distribution on four groups and two categories too. And numbers of countries in the groups and categories are equal to those in the rating by Democracy Index. In this article let us use for characterizing economic development level 2015 GNI (PPP) per capita counted up in international dollars (an international dollar has the same purchasing power over GNI of the country as a U.S. dollar has over GNI of the United States) in the capacity of basic indicator. The groups’ distribution of states corresponding to the previous one will be such:
1. Highly developed economies (GNI (PPP) per capita is equal or more than 31,000 international dollars) – 31 (19.4%)
2. Higher group of medium-developed economies (GNI (PPP) per capita from 13,600 to 31,000 international dollars) – 41 (25.6%)
3. Lower group of medium-developed economies (GNI (PPP) per capita from 5,400 to 13,600 international dollars) – 37 (23.1%)
4. Low developed economies (GNI (PPP) per capita is less than 5,400 international dollars) – 51 (31.9%)
The distribution by GNI (PPP) per capita between two categories of countries is such:
- Economies of relatively high-level development (with GNI (PPP) per capita of 13,600 international dollars or more) – 72 (45.0%)
- Economies of relatively low-level development (with GNI (PPP) per capita of less than 13,600 international dollars) – 88 (55.0%)
In the previous article it has been demonstrated that powerful correlation between the indicators of economy and democracy development does exist. And this correlation shows very strong connection between the social institutions of politics and the economy.
Below one can see the distribution of 160 countries embraced with my ratings among the eight political-economic regions of the world (the regions of Europe and Russia & Post-Soviet Asia are extracted by me from the World Bank etc. classifications’ region of “Europe & Central Asia” for better representation of their specific features):
1. Europe (including Belarus, Cyprus and Georgia) – 36
2. North America – 2
3. Latin America & the Caribbean – 23
4. Sub-Saharan Africa – 43
5. North Africa & Middle East (including Afghanistan, Iran and Turkey) – 22
6. South Asia – 6
7. East Asia & Pacific – 20
8. Russia & Post-Soviet Asia – 8
To finalize this part of my analysis, I would propose such a vision. The Democracy Index and GNI (PPP) per capita are generalizing – from the mankind/humanity viewpoint – indicators of the society’s development, government’s effectiveness & efficiency and individuals’ social comfort in the political and economic spheres of life correspondingly. Also in several cases (China, the Muslim world and so on) we see somewhat different attitude to both the indicators, mentioned in previous sentence, or at least to one of them because of the basic values’ ideological deviance at the societal level.
I believe that it is useful to calculate the analogue of politics Democracy Index measuring social institution of the economy results, namely: the Economic Performance Index. I propose to count up this index – like the Democracy Index – on a 0 to 10 scale as the simple division result, a country’s GNI (PPP) per capita being the numerator. As for the denominator, the country’s GNI (PPP) per capita of 100,000 international dollars current theoretical maximum seems adequate. The 2015 GNI (PPP) per capita of Qatar – 138,480 international dollars – and of Macao SAR, China – 102,480 international dollars – are the outcome of absolutely extraordinary circumstances, so their 2015 Economic Performance Index score is 10 exactly.
According to my hypothesis, at the global level now the economy functioning results for democratic and hybrid states often are relatively lower than those of the national polities and social institutions of politics because of several fundamental reasons. Firstly, social sciences including economics and science of government are not developed to the degree sufficient for the really effective (and efficient) governing the economy. Secondly, mass knowledge and skills of business administration, public administration, organizations etc. management and economic self-management are not sufficient too. Last but not least, rich in content methods and tools of societal governing the economy are more sophisticated and difficult for practical implementation than mainly formalized and embodied in law approaches and procedures of modern liberal democracy.
I believe that it is useful to introduce the indicator which provides us with combined reflection of all political and economic activities in a society outcome. I would propose to name it in such a way: the Political Economy Achievements Index. It will be calculated, also on a 0 to 10 scale, as the simple average of two indicators characterized earlier: the Democracy Index and the Economic Performance Index.
Because of “global economic lag” (please see above) the results reflected by the combined Political Economy Achievements Index are lower than those in the realm of “pure” politics. Under this ranking I have picked up four groups of countries with the scores of 5.50–10, 4–5.49, 3–3.99 and below 3 correspondingly. As one can see, per cent shares of all the groups are less than in both the Democracy Index and GNI (PPP) per capita cases:
1. Societies with the highest level of political economy achievements – 26 (16.3%)
2. Societies with high level of political economy achievements – 31 (19.4%)
3. Societies with satisfactory level of political economy achievements – 34 (21.3%)
4. Societies with low level of political economy achievements – 69 (43.1%)
The distribution between two categories in accordance with the Political Economy Achievements Index value is such:
- Societies with relatively high level of political economy achievements (the scores of 4–10) – 57 (35.6%)
- Societies with relatively low level of political economy achievements (the scores below 4) – 103 (64.4%)
As we see, substantially more – about two thirds – of the states in the world demonstrate relatively low level of political economy achievements and substantially less – only about a third – of the countries have reached relatively high level of political economy achievements.
In 22 countries’ cases the “outstripping” development of democracy or the economy strongly compensates the lag of other sphere and provides a society for rank in the group more “prestigious” than that under the “lagged” social institution rating. For the IPEA group 1, generally characterized with the “political economy social institutions” prosperous harmony, also the compensation by economic development is typical: we see three such bright examples – of Singapore, Qatar and Kuwait. In the highest group only Czech Republic demonstrates the compensation by the development of democracy which is quite widespread in the lowest third of the group 2: South Africa (the 2017 population of more than 55 million is forecasted!), India (1,343 million!!!), Jamaica, Indonesia (263 million!!) and Serbia represent it here. The United Arab Emirates only shows the “outstripping economy” compensatory mode in the second group and three states (Saudi Arabia, Oman and Bahrain) demonstrate it in the third group. On the contrary, for the group 3 – of societies with satisfactory level of political economy achievements – the “outstripping democracy” model is more appropriate too; this is characteristic for nine (!) of its states, namely: Timor-Leste, Ghana, Lesotho, Guyana, Zambia, Honduras, Papua New Guinea, Senegal and Bangladesh.
REGIONAL DISTRIBUTION OF COUNTRIES BY THE 2015 IPEA GROUPS
| COUNTRIES | Group 1 | Group 2 | Group 3 | Group 4 | TOTAL |
| 1. Europe | 15 | 14 | 5 | 2 | 36 |
| 2. North America | 2 | — | — | — | 2 |
| 3. Latin America & the Caribbean | — | 10 | 10 | 3 | 23 |
| 4. Sub-Saharan Africa | — | 3 | 5 | 35 | 43 |
| 5. North Africa & Middle East | 3 | 1 | 6 | 12 | 22 |
| 6. South Asia | — | 1 | 2 | 3 | 6 |
| 7. East Asia & Pacific | 6 | 2 | 6 | 6 | 20 |
| 8. Russia & Post-Soviet Asia | — | — | — | 8 | 8 |
| TOTAL | 26 | 31 | 34 | 69 | 160 |
Let me propose this final table to respected Readers for the analysis by themselves. Only quite poor state of the Russia & Post-Soviet Asia countries region is noteworthy and must be emphasized: they all belong to the group of societies with low level of political economy achievements… ‘To be continued.’