30 Primary Political-Economic Regions
20.02.2017 Yuriy O. CHERNETSKIY (Kharkiv and Zhytomyr),
Doctor of Sciences in Sociology, Ph.D. in Economics & Management, Master of Arts in Political Economy, author of 12 books and more than 400 articles – specially for the NEWSSKY.COM.UA Journal
About 30 Primary Political-Economic Regions and 8 Secondary (Enlarged) Regions of the World Correlation and Meaning
Dear Readers! Let me remind you that, continuing, developing and extending the Economist Intelligence Unit (EIU) work, in the first article of my series in English devoted to the international political economy, comparative government and economics matters I have proposed the set of three global rankings for 160 countries of the world with the 2014 and 2015 population of 0.7 million or more. Below the most important theoretical prerequisites of my study are described in brief.

Human beings – each of us – by the social nature are “political animals” (Aristotle) and cultural values bearers, co-producers and reproducers (these processes have been emphasized by Karl Marx, Max Weber, Talcott Parsons and many other social scientists), at the same time having the immanent “homo economicus” (the concept of economic man is based on the ideas of Adam Smith) potential which embraces abilities of goods and services production, exchange and consumption activity. That is why the social institutions of social values search, research & providing embedded, of politics, government & law and of the economy functioning results are of crucial importance for the effectiveness and efficiency (as first defined by Peter Drucker in 1967) of a society as it was presented in Road Maps to the Future – Towards More Effective Societies (1980) by Bohdan Hawrylyshyn. And the second article of my series has been devoted to the new conception and methods of their provision and evaluation.
It is noteworthy that the so called Democracy Index (DI), calculated by specialists of the EIU on a 0 to 10 scale, has not been counted up for South Sudan (11.3 million 2014 population) and Somalia (10.5 million 2014 population). These countries are “leaders” in sad sense for many years of so called Fragile States Index – its former name was the Failed States Index – ranking. In fact, they have no minimally effective government of the united state’s scale. Therefore, all 160 really existing and functioning states (countries) of the world with 0.7 million or more population have been and remain represented in my generalizing tables.
Also let me remind that, as the EIU does, I place countries within one of four types of regime according to their Democracy Index values. But, on my mind, the EIU’s differentiation of “full democracies” and “flawed democracies” is somewhat mechanical or formal. Taking into account the contents of polity, politics and policies, I single out developed democracies with the scores of 7.70–10; that adds to the highest group 14 countries, namely: Italy, South Korea, Costa Rica, Japan, the Czech Republic, Belgium, France, Botswana, Estonia, Chile, Taiwan, Portugal, Israel, India (Cabo Verde is out of my rating). The rest of “flawed democracies” constitutes the group of other democracies (the scores of 6–7.69) under my classification. Both the groups of countries with “hybrid regimes” (the scores of 4–5.99) and with “authoritarian regimes” (the scores below 4) are the same as in the EIU’s rating. Finally, the distribution of 160 states between four groups in my version is such:
- Developed democracies – 31 (19.4%)
- Other democracies – 41 (25.6%)
- Hybrid regimes – 37 (23.1%)
- Authoritarian regimes – 51 (31.9%)
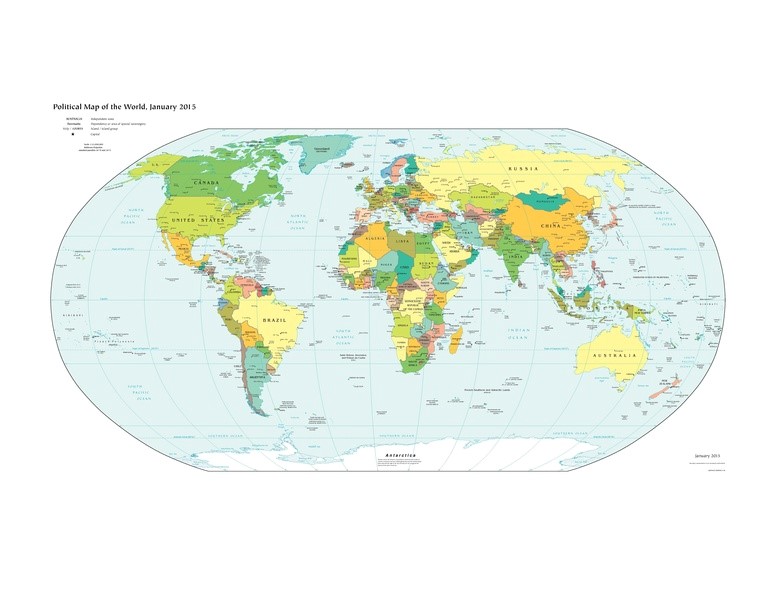
On this political map 196 countries of the world are presented
As we see, the group of authoritarian states is the most numerous: it embraces almost one third of all countries. And the group of developed democracies is the least numerous: it includes about one fifth of all states.
Further, it is useful to differentiate two categories of states: democratic countries (it embraces developed and other democracies) and non-democratic countries (it includes hybrid and authoritarian regimes). The distribution of 160 states will be such:
- Democratic countries – 72 (45.0%)
- Non-democratic countries – 88 (55.0%)
Substantially more than a half of the states in the world are non-democratic, substantially less than a half of political regimes are democratic. In my version of the countries rating by the Democracy Index 2015 difference between two categories’ ratios is 10% precisely.
To finalize my analysis, I would propose such a vision. The Democracy Index and GNI or GDP (PPP) per capita are generalizing – from the mankind/humanity viewpoint – indicators of the society’s development, government’s effectiveness & efficiency and individuals’ social comfort in the political and economic spheres of life correspondingly. Also in several cases (China, the Muslim World and so on) we see somewhat different attitude to both the indicators, mentioned in previous sentence, or at least to one of them because of the basic values’ ideological deviance at the societal level.
I believe that, measuring social institution of the economy results, it is useful to calculate the analogue of politics Democracy Index, namely: the Economic Performance Index (EPI). I propose to count up this index – like the Democracy Index – on a 0 to 10 scale as the simple division result, a country’s GNI (PPP) per capita being the numerator. As for the denominator, the country’s GNI (PPP) per capita of 100,000 international dollars current theoretical maximum seems adequate. For example, the 2015 GNI (PPP) per capita of Qatar – 138,480 international dollars – and of Macao SAR, China – 102,480 international dollars – are the outcome of absolutely extraordinary circumstances, so their 2015 Economic Performance Index score is 10 exactly.
According to my hypothesis, on a global scale now the economy functioning results for democratic and hybrid states often are relatively lower than those of the national polities and social institutions of politics, government & law because of several fundamental reasons. Firstly, social sciences including economics and science of government are not developed to the degree sufficient for the really effective (and efficient) governing the national economy. Secondly, in all societies of the world knowledge and skills of business administration, public administration, organizations management etc. are not sufficient too. Thirdly, the same must be the realistic evaluation of mass knowledge, skills and self-management related to individual economic activities. Last but not least, rich in content methods and tools of societal governing the economy are more sophisticated and difficult for practical implementation than mainly formalized and embodied in law approaches and procedures of modern liberal democracy.

On this map the data about 196 countries’ GDP (PPP) per capita are presented
My hypothesis is proved with information on Economic Performance Indexes for 160 countries of the world. The distribution by the EPI between four types of national economies is such (here and further in brackets after the EPI information one can find the ratios of the Democracy Index regimes’ groups of countries equivalent to economic ones from the political comfort for citizens viewpoint; it is useful to compare them):
- Highly developed economies (the EPI scores of 3.40–10) – 29, or 18.1% (19.4%)
- Higher group of medium-developed economies (the EPI scores of 2.60–3.39) – 11, or 6.9% (25.6%)
- Lower group of medium-developed economies (the EPI scores of 1.40–2.59) – 29, or 18.1% (23.1%)
- Low developed economies (the EPI scores below 1.40) – 91 (31.9%)
The distribution by the EPI between two categories of national economies is such:
- Economies of relatively high-level development (with the EPI scores of 2.60 or more) – 40 (25.0%)
- Economies of relatively low-level development (with the EPI scores of less than 2.60) – 120 (75.0%)
Finally, I have introduced the indicator which provides us with combined reflection of all political and economic activities in a society outcome. I would propose to name it in such a way: the Index of Political Economy Achievements (IPEA). It reflects the international or comparative political economy viewpoint. The index will be calculated, also on a 0 to 10 scale, as the simple average of two indicators characterized earlier: the Democracy Index and the Economic Performance Index.
Because of “global economic lag” (please see above) the results reflected by the combined Index of Political Economy Achievements are lower than those in the realm of “pure” politics. Also in several societal cases we see the same results comparing to the economy because of a democracy failure. Under this ranking I have picked up four groups of countries with the scores of 5.50–10, 4–5.49, 3–3.99 and below 3 correspondingly. As one can see, per cent shares of all the groups are less than in the Democracy Index cases:
- Societies with the highest level of political economy achievements – 26 (16.3%)
- Societies with high level of political economy achievements – 31 (19.4%)
- Societies with satisfactory level of political economy achievements – 34 (21.3%)
- Societies with low level of political economy achievements – 69 (43.1%)
The distribution between two categories of countries in accordance with the Index of Political Economy Achievements value is such:
- Societies with relatively high level of political economy achievements (the scores of 4–10) – 57 (6%)
- Societies with relatively low level of political economy achievements (the scores below 4) – 103 (4%)
About two thirds of the states demonstrate relatively low and only about a third of the countries have reached relatively high level of political economy achievements.
Then, I would propose the distribution of 160 countries embraced with my ratings among the eight, to say, enlarged or secondary regions of the world (the regions of Europe and Russia & Post-Soviet Asia are extracted by me from the World Bank etc. classifications’ region of “Europe & Central Asia” for better representation of their specific features):
- Europe (including Belarus, Cyprus and Georgia) – 36
- North America – 2
- Latin America & the Caribbean – 23
- Sub-Saharan Africa – 43
- North Africa & Middle East (including Iran and Turkey) – 21
- South Asia (including Afghanistan) – 7
- East Asia & Pacific – 20
- Russia & Post-Soviet Asia – 8
Table 1
RANKING OF EIGHT ENLARGED WORLD REGIONS BY THE IPEA
(The ratings embrace 160 countries of the world with the 2015 population of 0.7 million and more; after the enlarged regions’ names their political-economic regions are listed in alphabetical order, after the population data, democracy and economic performance indexes values – places of a region in the population, democracy index and economic performance index 2015 global ratings are shown in brackets)
|
REGIONS |
2015 Population (thousands) |
2015 Democracy Global Regional Index | 2015 Economic Performance Index | 2015 Index of Political Economy Achievements |
| 1. North America (Canada; United States) | 357,251 (7) | 8.15 (1) | 5.61 (1) | 6.88 |
| 2. Europe (Balkan non-EU countries; Eastern Europe – EU member states; Eastern Europe – non-EU countries; Scandinavia; Southern Europe; Western Europe) | 599,651 (5) | 7.76 (2) | 3.46 (2) | 5.61 |
| 3. Latin America & the Caribbean (Central America; South America; West Indies) | 626,730 (4) | 6.54 (4) | 1.49 (6) | 4.02 |
| 4. South Asia (South Asia Subregional Economic Cooperation (SASEC) countries; South Asia – western part) | 1,743,754 (2) | 7.03 (3) | 0.56 (7) | 3.80 |
| 5. East Asia & Pacific (Developed East Asia; Developing East Asia; Mainland Southeast Asia; Maritime Southeast Asia; Oceania) | 2,268,601 (1) | 4.40 (6) | 1.57 (5) | 2.99 |
| 6. North Africa & Middle East (Arabian Peninsula; Iran; Levant; Northern Africa; Turkey) | 541,646 (6) | 3.45 (7) | 1.74 (4) | 2.60 |
| 7. Russia & Post-Soviet Asia (Eastern Transcaucasia; Post-Soviet Central Asia; Russian Federation) | 255,423 (8) | 3.05 (8) | 1.94 (3) | 2.50 |
| 8. Sub-Saharan Africa (Central Africa; Eastern Africa; Southern Africa; Western Africa) | 940,243 (3) | 4.55 (5) | 0.36 (8) | 2.46 |
Sources of the data for the IPEA count: publications of the Economist Intelligence Unit (Democracy Index) and World Bank (population & GNI – or GDP – (PPP) per capita).
Even these “secondary” regions I treat as real communities of societies, with strong enough mutual influence of constituting countries, their governments and peoples in political, economic and spiritual spheres. All the regions are formed as common social space integrated to some degree. That is why I count up regional Democracy and Economic Performance Indexes as weighted arithmetic averages. Their numerator is the sum of products of numbers: each country index value is multiplied by its population and the results are added up. Their denominator is the population of this region. Table 1 reflects four ratings of eight enlarged (secondary) regions of the world.
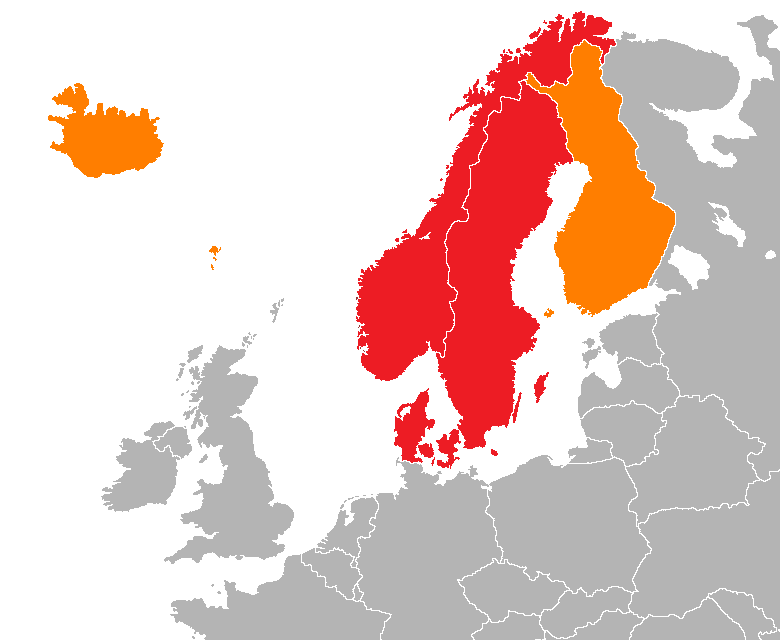
Scandinavia: according to the region name’s extended usage in English, Finland is included “on account of its historical association with Sweden and its Swedish minority.” Author – 000peter (2011).
But in the case of “enlarged” regions their inner differences are too substantial: we see just terrible stratification. For this reason I use the analyses of situation with the primary political-economic regions as the basic mode of my international political economy research. These primary regions are absolutely self-sufficient global actors of crucial importance. At the same time they function as the structural elements of enlarged regions.
Table 2
PRIMARY REGIONS OF THE WORLD 2015 RANKING BY THE IPEA
(The ratings embrace 160 countries with the 2015 population of 0.7 million and more; after the political-economic regions’ names their countries are listed in alphabetical order, after the population data, democracy and economic performance indexes values – places of a region in the population, democracy index and economic performance index 2015 global ratings are shown in brackets)
|
REGIONS |
2015 Population (thousands) |
2015 Democracy Global Regional Index | 2015 Economic Performance Index | 2015 Index of Political Economy Achievements |
| 1. Scandinavia (Denmark; Finland; Norway; Sweden) | 26,153 (28) | 9.38 (01) | 4.96 (02) | 7.17 |
| 2. United States (country-region) | 321,419 (07) | 8.05 (05) | 5.75 (01) | 6.90 |
| 3. Canada (country-region) | 35,852 (27) | 9.08 (02) | 4.40 (04) | 6.74 |
| 4. Western Europe (Austria; Belgium; France; Germany; Ireland; Netherlands; Switzerland; United Kingdom) | 263,121 (08) | 8.38 (03) | 4.47 (03) | 6.43 |
| 5. Developed East Asia (Japan; Republic of Korea; Taiwan, the Province of China) | 201,065 (12) | 7.96 (07) | 3.89 (06) | 5.93 |
| 6. Oceania (Australia; Fiji; New Zealand; Papua New Guinea) | 36,888 (25) | 8.35 (04) | 3.40 (07) | 5.88 |
| 7. Southern Europe (Cyprus – area controlled by the government of Cyprus; Greece; Italy; Portugal; Spain) | 129,241 (16) | 8.03 (06) | 3.40 (07) | 5.72 |
| 8. Eastern Europe – EU member states (Bulgaria; Croatia; Czech Republic; Estonia; Hungary; Latvia; Lithuania; Poland; Romania; Slovakia; Slovenia) | 103,317 (17) | 7.12 (10) | 2.46 (09) | 4.79 |
| 9. Southern Africa (Botswana; Lesotho; Namibia; South Africa; Swaziland) | 63,100 (23) | 7.40 (09) | 1.25 (18) | 4.33 |
| 10. South America (Argentina; Bolivia; Brazil; Chile; Columbia; Ecuador; Guyana; Paraguay; Peru; Uruguay; Venezuela) | 417,634 (03) | 6.72 (12) | 1.52 (13) | 4.12 |
| 11. Maritime Southeast Asia (Indonesia; Malaysia; Philippines; Singapore; Timor-Leste) | 395,374 (04) | 6.92 (11) | 1.24 (19) | 4.08 |
| 12. South Asia Subregional Economic Cooperation countries (Bangladesh; Bhutan; India; Nepal; Sri Lanka) | 1,522,302 (01) | 7.45 (08) | 0.58 (26) | 4.02 |
| 13. Central America (Costa Rica; El Salvador; Guatemala; Honduras; Mexico; Nicaragua; Panama) | 172,381 (13) | 6.47 (13) | 1.49 (15) | 3.98 |
| 14. Balkan non–EU countries (Albania; Bosnia and Herzegovina; Macedonia, the FYR; Serbia) | 15,875 (29) | 6.02 (14) | 1.22 (20) | 3.62 |
| 15. Turkey (country-region) | 78,666 (21) | 5.12 (16) | 1.94 (11) | 3.53 |
| 16. Arabian Peninsula (Bahrain; Kuwait; Oman; Qatar; Saudi Arabia; United Arab Emirates; Yemen) | 79,416 (19) | 2.34 (29) | 4.06 (05) | 3.20 |
| 17. Eastern Europe – non-EU countries (Belarus; Georgia, excl. Abkhazia and S. Ossetia; Moldova – Republic of, excl. Transnistria; Ukraine) | 61,944 (24) | 5.43 (15) | 0.92 (24) | 3.18 |
| 18. West Indies (Cuba; Dominican Republic; Haiti; Jamaica; Trinidad and Tobago) | 36,715 (26) | 4.97 (17) | 1.20 (21) | 3.09 |
| 19. Russian Federation (country-region) | 144,097 (15) | 3.31 (24) | 2.38 (10) | 2.85 |
| 20. Levant (Iraq; Israel; Jordan; Lebanon; Palestine; Syrian Arab Republic) | 81,173 (18) | 3.92 (22) | 1.37 (17) | 2.65 |
| 21. Western Africa (Benin; Burkina Faso; Côte D’Ivoire; Gambia; Ghana; Guinea; Guinea Bissau; Liberia; Mali; Mauritania; Niger; Nigeria; Senegal; Sierra Leone; Togo) | 352,701 (06) | 4.71 (18) | 0.41 (28) | 2.56 |
| 22. Mainland Southeast Asia (Cambodia; Lao People’s Democratic Republic; Myanmar; Thailand; Viet Nam) | 235,940 (09) | 4.13 (21) | 0.82 (25) | 2.48 |
| 23. Eastern Africa (Burundi; Comoros; Djibouti; Eritrea; Ethiopia; Kenya; Madagascar; Malawi; Mauritius; Mozambique; Rwanda; Tanzania; Uganda; Zambia; Zimbabwe) | 372,682 (05) | 4.59 (19) | 0.20 (30) | 2.40 |
| 24. South Asia – western part (Afghanistan; Pakistan) | 221,452 (11) | 4.16 (20) | 0.48 (27) | 2.32 |
| 25. Developing East Asia (China; Democratic People’s Republic of Korea; Mongolia) | 1,339,334 (02) | 3.11 (25) | 1.42 (16) | 2.27 |
| 25. Eastern Transcaucasia (Armenia; Azerbaijan) | 12,669 (30) | 3.02 (26) | 1.52 (13) | 2.27 |
| 25. Northern Africa (Algeria; Egypt; Libya; Morocco; Sudan; Tunisia) | 223,174 (10) | 3.55 (23) | 0.98 (23) | 2.27 |
| 28. Iran (country-region) | 79,109 (20) | 2.16 (30) | 1.70 (12) | 1.93 |
| 29. Post-Soviet Central Asia (Kazakhstan; Kyrgyzstan; Tajikistan; Turkmenistan; Uzbekistan) | 68,657 (22) | 2.52 (28) | 1.08 (22) | 1.80 |
| 30. Central Africa (Angola; Cameroon; Central African Republic; Chad; Congo; Democratic Republic of the Congo; Equatorial Guinea; Gabon) | 151,760 (14) | 2.90 (27) | 0.27 (29) | 1.59 |
Sources of the data for the IPEA count: publications of the Economist Intelligence Unit (Democracy Index) and World Bank (population & GNI – or GDP – (PPP) per capita).
Let us begin to generalize and to analyze the information from Table 2 in the mode used earlier. Only per cent data in brackets reflect ratios of the corresponding regions’ summed up population in the aggregate 2015 population of 160 countries included in my ratings.
The four groups’ distribution of primary world regions from the viewpoint of POLITICAL achievements (development of democracy) is such:
- Regions with high level of political achievements (the DI scores of 7.70–10) – 7 (13.8%)
- Regions with satisfactory level of political achievements (the DI scores of 6–7.69) – 7 (36.7%)
- Regions with low level of political achievements (the DI scores of 4–5.99) – 7 (18.5%)
- Regions with very low level of political achievements (the DI scores below 4) – 9 (30.9%)
The two categories’ distribution of primary world regions from the viewpoint of political achievements is such:
- Regions with relatively high level of political achievements (the DI scores of 6–10) – 14 (50.5%)
- Regions with relatively low level of political achievements (the DI scores below 4) – 16 (49.5%)
The four groups’ distribution of primary world regions from the viewpoint of ECONOMIC achievements (aggregate regional GNI or GDP (PPP) per capita) is such:
- Regions with the highest level of economic achievements (the EPI scores of 3.40–10) – 8 (14.9%)
- Regions with high level of economic achievements (the EPI scores of 2.60–3.39) – — (0.0%)
- Regions with medium level of economic achievements (the EPI scores of 1.40–2.59) – 8 (32.0%)
- Regions with low level of economic achievements (the EPI scores below 1.40) – 14 (53.1%)
The two categories’ distribution of primary world regions from the viewpoint of economic achievements is such:
- Regions with relatively high level of economic achievements (the EPI scores of 2.60 or more) – 8 (9%)
- Regions with relatively low level of economic achievements (the EPI scores of less than 2.60) – 22 (1%)
The four groups’ distribution of primary world regions from the viewpoint of POLITICAL ECONOMY achievements (combined development of democracy and aggregate regional economy) is such:
- Regions with the highest level of political economy achievements (the IPEA scores of 5.50–10) – 7 (13.8%)
- Regions with high level of political economy achievements (the IPEA scores of 4–5.49) – 5 (34.1%)
- Regions with satisfactory level of political economy achievements (the IPEA scores of 3–3.99) – 6 (6.1%)
- Regions with low level of political economy achievements (the IPEA scores below 3) – 12 (46.0%)
The two categories’ distribution of primary world regions from the viewpoint of political economy achievements is such:
- Regions with relatively high level of political economy achievements (the IPEA scores of 4–10) – 12 (47.9%)
- Regions with relatively low level of political economy achievements (the IPEA scores below 4) – 18 (52.1%)
“To be continued.”