ON 55 STATES AND 20 PRIMARY POLITICAL-ECONOMIC REGIONS OF GLOBAL EUROPE: FAREWELL PAPER FOR THE SERIES
23.03.2019Yuriy O. CHERNETSKIY
Doctor of Sociological Sciences, Ph.D. in Economics & Management, Professor of the Zhytomyr Economics & the Humanities Institute (The “Ukraine” University)
The concept of Global Europe, or the European World, and four new statistical indicators – the National Economic Performance Index (NEPI), the Index of Political Economy Achievements (IPEA), the Democracy Global Regional Index (DGRI) and the Regional Economic Performance Index (REPI) – are substantiated and implemented. The set of international political economy rankings for 50 countries with the 2016 population of 0.3 million or more and the same set for 20 primary political-economic regions of Global Europe are presented.
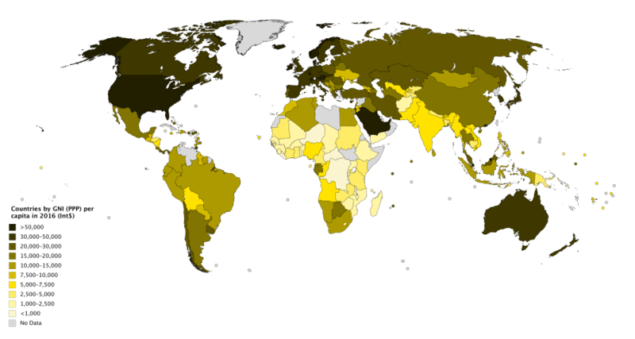
Countries of the world by GNI (PPP) per capita in 2016. Author – JackintheBox (2018)
Before presenting the data about countries and primary political-economic regions of Global Europe (please see Tables 1 and 2), I have to introduce the very concept of Global Europe, or the European World, developed by me. According to it, first of all, the European World core embraces 48 sovereign states, in territorial sense wholly belonging to “physical-geographic” Europe, and also 7 countries of other continents, namely: Canada, the United States, Australia, New Zealand, Israel, Cyprus and Georgia. In four mentioned countries of the “New World” societies and statehood have developed in a successively or consistently European way for ages. Three states of physical-geographic Asia obviously orient themselves onto resulting distinctively European-styled social values of liberty, democracy and humanism. These values remain of crucial importance for societal discourse in all the countries of physical-geographic Europe and define outstanding progressive role of the European World in global social development.
By the way, let me remind: “When the South Caucasus is incorporated into the concept of Europe, as occurs today in many international organisations, the southeastern border of Europe lies on the Aras River opposite Iran” [Jahn, 2015: p. 21]. I rely upon this approach and accordingly include in my Global Europe not only Georgia but also Armenia and Azerbaijan. On my mind, today the last two states form the European region of South-Eastern Caucasus.
It is known that from the Greek antiquity times Europe was regarded as the land mass to the west of the Bosporus and the Dardanelles. “The water border of the straits between Europe and Asia was extended northwards via the Black Sea to the Don (Tanais), which remained the eastern border of Europe until the seventeenth century. Kievan Rus’, the old Russia (not “Russia”, but UKRAINE! – Y.C.), was naturally considered to be a part of Europe” [Jahn, 2015: p. 20]. In the first third of the eighteenth century, scientist Philip Johan von Strahlenberg moved the geographical eastern border of Europe to the Urals, the Emba and the Manytch lowlands; later, others moved its southeastern border to the Ural River.
It means that three more states are situated partly in physical-geographic Europe, namely: Turkey, the Russian Federation and Kazakhstan. At the same time, these mainly Asian – by territory – countries, like (what a pity…) two South-Eastern Caucasus states, now obviously are NOT a part of Europe as the “community of values” (and seven mentioned countries of my Global Europe which from the physical-geographic viewpoint are not European, including purely Asian Cyprus and Israel, in cultural sense ARE). That is why I name five “deviating” states the Eurasian periphery of the European World.
To my ratings I include not 55, but 50 states of Global Europe. It is because the so called Democracy Index (DI) was not counted up for five European “micro-states” with the least numerous 2016 population: Andorra (77 thousands), Monaco (38 thousands), Liechtenstein (also 38 thousands), San Marino (33 thousands) and Vatican (about 1 thousand). This index, calculated by specialists of the Economist Intelligence Unit (EIU), became the initial basic indicator for my research. The methodology of DI calculation is characterized, for example, in the publication “Democracy Index 2017: Free speech under attack” [Democracy Index 2017 (IEU), 2018] which can be found on the EIU site in PDF format. This index, on a 0 to 10 scale, is based on the ratings for 60 main political indicators.
In the process of my interdisciplinary research I have proved that it is useful to calculate the analogue of politics Democracy Index measuring social institution of the economy results, namely: the National Economic Performance Index (NEPI). I would propose to count up this index – like the DI – on a 0 to 10 scale as the simple division result, a country’s GNI (PPP) per capita being the numerator. As for the denominator, the country’s GNI (PPP) per capita of 100,000 international dollars current theoretical maximum seems adequate. For example, the 2015 GNI (PPP) per capita of Qatar – 138,480 international dollars [Gross national income per capita 2015 (World Bank), 2016] – had been the outcome of absolutely extraordinary circumstances, and its 2015 NEPI score was 10 exactly.
Finally, I have proved that it is useful to introduce the indicator which provides us with combined reflection of all political and economic activities in a society outcome. I have named it in such a way: the Index of Political Economy Achievements (IPEA). It reflects the international or comparative political economy viewpoint. The index for a country is calculated, also on a 0 to 10 scale, as the simple average of two indicators characterized earlier: the Democracy Index and the National Economic Performance Index.
In order to finalize the previous part of my analysis, I would propose such a vision. The Democracy Index and GNI or GDP (PPP) per capita are generalizing – from the mankind/humanity viewpoint – indicators of the society’s development, government’s effectiveness & efficiency and individuals’ social comfort in the political and economic spheres of life correspondingly. Also in several cases (Belarus, Russia and other Eurasian post-Soviet “demotic autocracies” [Jahn, 2015: p. 11], “Muslim” Turkey and so on) we see somewhat different attitude to both the indicators, mentioned in previous sentence, or at least to one of them because of the basic values’ ideological deviance at the societal level.
My material’s go is the Table 1 (please see below) which contains the information on five ratings for 50 countries of the European World with the 2015 and 2016 population of 0.3 million or more. The above-mentioned Democracy Index (DI), calculated by specialists of the EIU, is the basic indicator for inclusion.
Therefore, all 50 sovereign states of Global Europe with 0.3 million or more 2015/2016 population are presented in my basic rating table.
Table 1
2016 RANKING BY THE INDEX OF POLITICAL ECONOMY ACHIEVEMENTS
(for 50 sovereign states of Global Europe with the 2016 population of 0.3 million and more; after the population data, Democracy, National Economic Performance Indexes’ values and IPEA’s dynamics indicators – places of a country in the population, DI, NEPI and IPEA change 2016 ratings are shown in brackets)
|
COUNTRIES |
2016 population (thousands) |
2016 Democracy Index |
2016 National Economic Performance Index | 2016 Index of Political Economy Achievements | 2016 IPEA change comparing to 2015 |
| 1. Norway | 5,233 (32) | 9.93 (01) | 6.26 (03) | 8.10 | –.09 (47) |
| 2. Luxembourg | 583 (48) | 8.81 (11) | 7.04 (01) | 7.93 | –.05 (43) |
| 3. Switzerland | 8,372 (26) | 9.09 (08) | 6.37 (02) | 7.73 | +.05 (26) |
| 4. Ireland | 4,773 (33) | 9.15 (06) | 5.69 (05) | 7.42 | +.40 (01) |
| 5. Iceland | 334 (50) | 9.50 (02) | 5.25 (06) | 7.38 | +.26 (02) |
| 6. Sweden | 9,903 (20) | 9.39 (03) | 5.00 (10) | 7.20 | +.10 (11) |
| 7. Denmark | 5,731 (29) | 9.20 (05) | 5.11 (07) | 7.16 | +.21 (03) |
| 8. Netherlands | 17,018 (15) | 8.80 (12) | 5.07 (08) | 6.94 | +.07 (19) |
| 9. United States | 323,128 (01) | 7.98 (18) | 5.87 (04) | 6.93 | +.03 (29) |
| 10. Australia | 24,127 (12) | 9.01 (10) | 4.60 (12) | 6.81 | +.07 (19) |
| 11. Germany | 82,668 (03) | 8.63 (13) | 4.97 (11) | 6.80 | +.06 (24) |
| 12. Canada | 36,286 (11) | 9.15 (06) | 4.34 (15) | 6.75 | +.01 (35) |
| 13. Austria | 8,747 (24) | 8.41 (14) | 5.06 (09) | 6.74 | +.07 (19) |
| 14. Finland | 5,495 (30) | 9.03 (09) | 4.38 (14) | 6.71 | +.13 (07) |
| 15. New Zealand | 4,693 (34) | 9.26 (04) | 3.77 (19) | 6.52 | +.11 (09) |
| 16. United Kingdom | 65,637 (06) | 8.36 (16) | 4.21 (16) | 6.29 | +.10 (11) |
| 17. Belgium | 11,348 (16) | 7.77 (25) | 4.60 (12) | 6.19 | +.02 (33) |
| 18. France | 66,896 (05) | 7.92 (20) | 4.21 (16) | 6.07 | +.09 (15) |
| 19. Malta | 437 (49) | 8.39 (15) | 3.58 (22) | 5.99 | +.17 (05) |
| 20. Spain | 46,444 (08) | 8.30 (17) | 3.65 (21) | 5.98 | +.10 (11) |
| 21. Italy | 60,601 (07) | 7.98 (18) | 3.84 (18) | 5.91 | +.12 (08) |
| 22. Israel | 8,547 (25) | 7.85 (22) | 3.73 (20) | 5.79 | +.14 (06) |
| 23. Czech Republic | 10,562 (18) | 7.82 (24) | 3.27 (23) | 5.55 | +.05 (26) |
| 24. Portugal | 10,325 (19) | 7.86 (21) | 3.00 (26) | 5.43 | +.10 (11) |
| 25. Cyprus (area controlled by the government of Cyprus) |
847 (46) |
7.65 (26) |
3.14 (25) |
5.40 |
+.08 (16) |
| 26. Slovenia | 2,065 (43) | 7.51 (27) | 3.24 (24) | 5.38 | +.07 (19) |
| 27. Estonia | 1,316 (45) | 7.85 (22) | 2.89 (28) | 5.37 | +.08 (16) |
| 28. Lithuania | 2,872 (41) | 7.47 (28) | 2.88 (29) | 5.18 | +.08 (16) |
| 29. Slovakia | 5,429 (31) | 7.29 (30) | 2.99 (27) | 5.14 | +.06 (24) |
| 30. Greece | 10,747 (17) | 7.23 (31) | 2.69 (30) | 4.96 | –.11 (49) |
| 31. Latvia | 1,960 (44) | 7.31 (29) | 2.59 (32) | 4.95 | +.05 (26) |
| 32. Poland | 37,948 (10) | 6.83 (33) | 2.68 (31) | 4.76 | –.06 (45) |
| 33. Hungary | 9,818 (21) | 6.72 (35) | 2.56 (33) | 4.64 | –.01 (37) |
| 34. Croatia | 4,171 (35) | 6.75 (34) | 2.29 (37) | 4.52 | –.04 (41) |
| 35. Bulgaria | 7,128 (27) | 7.01 (32) | 1.95 (39) | 4.48 | +.03 (29) |
| 36. Romania | 19,705 (13) | 6.62 (36) | 2.30 (35) | 4.46 | +.07 (19) |
| 37. Serbia | 7,057 (28) | 6.57 (37) | 1.39 (44) | 3.98 | –.03 (38) |
| 38. Montenegro | 623 (47) | 5.72 (41) | 1.79 (40) | 3.76 | –.04 (41) |
| 39. Turkey | 79,512 (04) | 5.04 (44) | 2.42 (34) | 3.73 | +.20 (04) |
| 40. Albania | 2,876 (40) | 5.91 (40) | 1.17 (46) | 3.54 | +.03 (29) |
| 41. Moldova (Republic of, excl. Transnistria) |
3,552 (37) |
6.35 (38) |
0.57 (50) |
3.46 |
+.01 (35) |
| 42. Georgia (excl. Abkhazia and S. Ossetia) |
3,719 (36) |
5.93 (39) |
0.95 (47) |
3.44 |
+.03 (29) |
| 43. North Macedonia | 2,081 (42) | 5.23 (43) | 1.45 (43) | 3.34 | –.35 (50) |
| 44. Ukraine | 45,005 (09) | 5.70 (42) | 0.82 (49) | 3.26 | +.02 (33) |
| 45. Bosnia and Herzegovina |
3,517 (38) |
4.87 (45) |
1.24 (45) |
3.06 |
+.11 (09) |
| 46. Russian Federation | 144,342 (02) | 3.24 (48) | 2.25 (38) | 2.75 | –.10 (48) |
| 47. Kazakhstan | 17,797 (14) | 3.06 (49) | 2.30 (35) | 2.68 | –.03 (38) |
| 48. Belarus | 9,507 (23) | 3.54 (47) | 1.72 (41) | 2.63 | –.03 (38) |
| 49. Armenia | 2,925 (39) | 3.88 (46) | 0.90 (48) | 2.39 | –.05 (43) |
| 50. Azerbaijan | 9,762 (22) | 2.65 (50) | 1.62 (42) | 2.14 | –.08 (46) |
Sources of the data for the NEPI and IPEA count: publications of the Economist Intelligence Unit (Democracy Index) and World Bank (population & GNI (PPP) per capita).
Under the ranking by the IPEA I have picked up four groups of states with the scores of 5.50–10, 4–5.49, 3–3.99 and below 3 correspondingly. Further one can see per cent shares of all the groups in Global Europe:
- Societies with the highest level of political economy achievements – 23 (46.0%)
- Societies with high level of political economy achievements – 13 (26.0%)
- Societies with satisfactory level of political economy achievements – 9 (18.0%)
- Societies with low level of political economy achievements – 5 (10.0%)
The last group includes four of five states of the Eurasian periphery of Global Europe (except Turkey) and Belarus with its “demotic autocracy” form of government.
And the distribution between two categories of countries by their IPEA values in 2016 was such:
- Societies with relatively high level of political economy achievements (the scores of 4–10) – 36 (0%)
- Societies with relatively low level of political economy achievements (the scores below 4) – 14 (0%)
In 2016 almost all countries of the highest level of political economy achievements group attained IPEA growth, and often very substantial. It was their distinctive feature: 91% of the highest group countries of Global Europe demonstrated IPEA growth, comparing to 69% in the 2nd group, 67% in the 3rd group and 0% (!!!) in the group of societies with low level of political economy achievements. Also 11 of the highest group countries (almost 48%) attained the growth of +.10 or more, like only 3 (11%) from the rest of 27 states.
Let me stress further the methodological moment of crucial importance. Because each region of the world is formed as common social space integrated to some degree, I count up Democracy Global Regional Index (DGRI) and Regional Economic Performance Index (REPI), introduced by me, as weighted arithmetic averages. Their numerator is the sum of products of numbers: each country index value is multiplied by its population and the results are added up. Their denominator is the population of this region. That is why I specify my regional DI (accenting difference with EIU one) namely as the Global index.
In general, I use the analyses of situation with the primary political-economic regions of the world as the basic mode of my international political economy research. These primary regions are absolutely self-sufficient global actors of decisive significance. At the same time they function as the structural elements of “enlarged” or secondary regions. In the case of Global Europe I would analyze 20 primary political-economic regions (please see the Table 2 below).
Table 2
PRIMARY REGIONS OF GLOBAL EUROPE 2016 RANKING BY THE IPEA
(the ratings embrace 55 countries with the 2016 population of 0.3 million and more for which the Democracy Index was counted up; after the political-economic regions’ names their countries are listed in alphabetical order, after the population data, Democracy Global Regional and Regional Economic Performance Indexes’ values – places of a region in the population, DGRI and REPI 2016 Global Europe ratings are shown in brackets)
|
REGIONS |
2016 population (thousands) |
2016 Democracy Global Regional Index (DGRI) | 2016 Regional Economic Performance Index |
2016 Index of Political Economy Achievements |
| 1. Scandinavia (Denmark; Finland; Iceland; Norway; Sweden) | 26,696 (13) | 9.38 (01) | 5.15 (02) | 7.27 |
| 2. United States (country-region) | 323,128 (01) | 7.98 (08) | 5.87 (01) | 6.93 |
| 3. Central Europe – western part (Austria; Germany; Switzerland) | 99,787 (04) | 8.65 (04) | 5.10 (03) | 6.88 |
| 4. Developed Oceania (Australia; New Zealand) | 28,820 (11) | 9.05 (03) | 4.46 (04) | 6.76 |
| 5. Canada (country-region) | 36,286 (10) | 9.15 (02) | 4.34 (06) | 6.75 |
| 6. British Isles (Ireland; United Kingdom) | 70,410 (07) | 8.41 (05) | 4.31 (07) | 6.36 |
| 7. Mainland Western Europe (Belgium; France; Luxembourg; Netherlands) | 95,845 (05) | 8.06 (07) | 4.43 (05) | 6.25 |
| 8. Southwestern Europe (Italy; Malta; Portugal; Spain) | 117,807 (02) | 8.10 (06) | 3.69 (08) | 5.90 |
| 9. Developed Eastern Mediterranean states (Cyprus – area controlled by the government of Cyprus; Greece; Israel) | 20,141 (14) | 7.51 (09) | 3.15 (09) | 5.33 |
| 10. Baltic states (Estonia; Latvia; Lithuania) | 6,148 (20) | 7.50 (10) | 2.79 (10) | 5.15 |
| 11. Central Europe – eastern part (Czech Republic; Hungary; Poland; Slovakia) | 63,757 (08) | 7.02 (11) | 2.79 (10) | 4.91 |
| 12. The FYRs – EU member states (Croatia; Slovenia) | 6,236 (19) | 7.00 (12) | 2.60 (12) | 4.80 |
| 13. Southeastern Europe – EU member states (Bulgaria; Romania) | 26,833 (12) | 6.72 (13) | 2.21 (16) | 4.47 |
| 14. Turkey (country-region) | 79,512 (06) | 5.04 (16) | 2.42 (13) | 3.73 |
| 15. Balkan non–EU countries (Albania; Bosnia and Herzegovina; Montenegro; North Macedonia; Serbia) | 16,154 (16) | 5.88 (14) | 1.34 (19) | 3.61 |
| 16. Southeastern Europe – non-EU countries (Georgia, excl. Abkhazia and S. Ossetia; Moldova – Republic of, excl. Transnistria; Ukraine) | 52,276 (09) | 5.42 (15) | 0.81 (20) | 3.29 |
| 17. Russian Federation (country-region) | 144,342 (02) | 3.24 (18) | 2.25 (15) | 2.75 |
| 18. Kazakhstan (country-region) | 17,797 (15) | 3.06 (19) | 2.30 (14) | 2.68 |
| 19. Belarus (country-region) | 9,507 (18) | 3.54 (17) | 1.72 (17) | 2.63 |
| 20. South-Eastern Caucasus (Armenia; Azerbaijan) | 12,687 (17) | 2.93 (20) | 1.45 (18) | 2.19 |
Sources of the data for the DGRI, REPI and IPEA count: publications of the Economist Intelligence Unit (Democracy Index) and World Bank (population & GNI (PPP) per capita).
Let us compare the distribution of 50 Global Europe countries and their per cent shares between the IPEA groups (please see below in brackets) with the 20 primary political-economic regions of the European World including 50 societies one (please see before the brackets):
- Primary regions with the highest level of political economy achievements – 8, or 40.0% (23, or 46.0%)
- Primary regions with high level of political economy achievements – 5, or 25.0% (13, or 26.0%)
- Primary regions with satisfactory level of political economy achievements – 3, or 15.0% (9, or 18.0%)
- Primary regions with low level of political economy achievements – 4, or 20.0% (5, or 10.0%)
Substantially lower share of the first group and even more substantially higher share of the fourth group among the regions of Global Europe comparing to the states distribution are explained with shares of – to say – countries-regions, i.e. of unique societal (social) systems that can’t be embraced under any regional unity. There are two countries-regions of eight primary regions with the highest level of political economy achievements (the United States and Canada) and three countries-regions of four primary regions with low level of political economy achievements (the Russian Federation, Kazakhstan and Belarus).
The distribution between two categories of the 20 primary political-economic regions including 50 societies (and of the 50 countries) by their IPEA values in 2016 was such:
- Primary regions with relatively high level of political economy achievements, i.e., the scores of 4–10 – 13, or 65.0% (36, or 0%)
- Primary regions with relatively low level of political economy achievements, i.e., the scores below 4 – 7, or 35.0% (14, or 0%)
The regions of Global Europe as an international community has been, is and will remain in the nearest future of dominating role at the vanguard of global political-economic progress. These regions take the vast majority – 13 from 15 leading positions – in my 40 primary regions of the world 2016 IPEA rating. Only places # 8 and # 14 belong to Asia (its highly developed eastern part) and South America (its relatively high developed southern part) correspondingly [Chernetskiy, 2018 (2)]. As we can see, the mentioned part (15 leading positions) of the 2016 IPEA ranking embraces the group of primary regions with the highest level of political economy achievements and the upper half of the group of primary regions with high level of political economy achievements. Also Europe in proper, narrow sense (including Georgia!) is present in the third group of primary regions with satisfactory level of political economy achievements, in its upper half (the Balkan non-EU countries) and closer to the end of lower half (Southeastern Europe – the non-EU countries).
CONCLUSIONS
This paper is an attempt to continue, develop and extend my 2016–2018 research work devoted to the sociology, international political economy, science of comparative government and economics matters [Chernetskiy, 2016; Chernetskiy, 2017 (1); Chernetskiy, 2017 (2); Chernetskiy, 2017 (3); Chernetskiy, 2017 (4); Chernetskiy, 2018 (1); Chernetskiy, 2018 (2); Chernetskiy, 2018 (3)]. During my research, among other findings, powerful correlation between the GDP / GNI (PPP) per capita and the Democracy Index has shown that very strong positive (i.e., definite and practical) connection exists between the democracy and the economy development. This fact has provided the additional argument to treat the social institutions of politics, government & law and of the economy whole functioning outcome as inseparably connected, integral political-economic result for each society.
Under this context, the concept and conception of Global Europe (or the European World), consisting of 55 sovereign states, has been substantiated and implemented. These countries form 20 primary global political-economic regions which became and would remain the subject matter of my in-depth research.
Sources
Chernetskiy Y. Democracy and economic development: again about the today’s world and Ukraine’s place in it (Very brief English version) [Electronic resource] / Y.Chernetskiy // NEWSSKY.COM.UA: [Internet Journal]. – 2016. – September 24. – Way of access: https://newssky.com.ua/democracy-and-economic-development/.
Chernetskiy Y. The Index of Political Economy Achievements (IPEA) global ranking: on & to the new conception of societal governance [Electronic resource] / Y.Chernetskiy // NEWSSKY.COM.UA: [Internet Journal]. – 2017 (1). – January 26. – Way of access: https://newssky.com.ua/the-index-of-political-economy/.
Chernetskiy Y. About 30 primary political-economic regions and 8 secondary (enlarged) regions of the world correlation and meaning [Electronic resource] / Y.Chernetskiy // NEWSSKY.COM.UA: [Internet Journal]. – 2017 (2). – February 20. – Way of access: https://newssky.com.ua/political-economic-regions/.
Chernetskiy Y.O. About the new comparative government and international political economy paradigm / Y.O.Chernetskiy // Aktualni problemy molodi v suchasnykh sotsialno-ekonomichnykh umovakh: Materialy Mizhnarodnoyi naukovo-praktychnoyi konferentsiyi, 23–24 bereznia 2017 roku. – Zhytomyr: FOP Filinskyi H.V., 2017 (3). – P. 135–146.
Chernetskiy Y. From the 30 – to the 40 primary political-economic regions of the world and Global Europe concepts & conceptions [Electronic resource] / Y.Chernetskiy // NEWSSKY.COM.UA: [Internet Journal]. – 2017 (4). – June 7. – Way of access: https://newssky.com.ua/from-the-30-to-the-40-primary-political-economic-regions-of-the-world-and-global-europe-concepts-conceptions/.
Chernetskiy Y. On the 160 states and 40 primary political-economic regions of the world under my global ranking. Part I: Countries and the “enlarged or secondary” regions [Electronic resource] / Y.Chernetskiy // NEWSSKY.COM.UA: [Internet Journal]. – 2018 (1). – February 22. – Way of access: https://newssky.com.ua/countries-and-the-enlarged-or-secondary-regions/.
Chernetskiy Y. On the 160 states and 40 primary political-economic regions of the world under my global ranking. Part II: Information on the primary global political-economic regions [Electronic resource] / Y.Chernetskiy // NEWSSKY.COM.UA: [Internet Journal]. – 2018 (2). – March 3. – Way of access: https://newssky.com.ua/information-on-the-primary-global-political-economic-regions/.
Chernetskiy Y. On the 160 states and 40 primary political-economic regions of the world under my global ranking. Part III: The 40 primary global political-economic regions development in 2016 [Electronic resource] / Y.Chernetskiy // NEWSSKY.COM.UA: [Internet Journal]. – 2018 (3). – March 12. – Way of access: https://newssky.com.ua/part-iii-the-40-primary-global-political-economic-regions-development-in-2016/.
Democracy Index 2015: Democracy in an age of anxiety. – London etc. : The Economist Intelligence Unit Limited, 2016.
Democracy Index 2016: Revenge of the “deplorables”. – London etc. : The Economist Intelligence Unit Limited, 2017.
Gross national income per capita 2015, Atlas method and PPP: World Development Indicators database / World Bank. – 2016. – 16 December.
Gross national income per capita 2016, Atlas method and PPP: World Development Indicators database / World Bank. – 2017. – 15 December.
Jahn E. International politics: Political issues under debate / E.Jahn. – Vol. 1. – Heidelberg etc.: Springer-Verlag, 2015.
Population 2015: World Development Indicators database / World Bank. – 2016. – 16 December.
Population 2016: World Development Indicators database / World Bank. – 2017. – 15 December.

Asteas (c. 370–360 BC). “Europa and the Bull”